File:Figure 10 CP-Ti Fatigue.png
From EVOCD

Size of this preview: 693 × 600 pixels.
Full resolution (1,160 × 1,004 pixels, file size: 118 KB, MIME type: image/png)
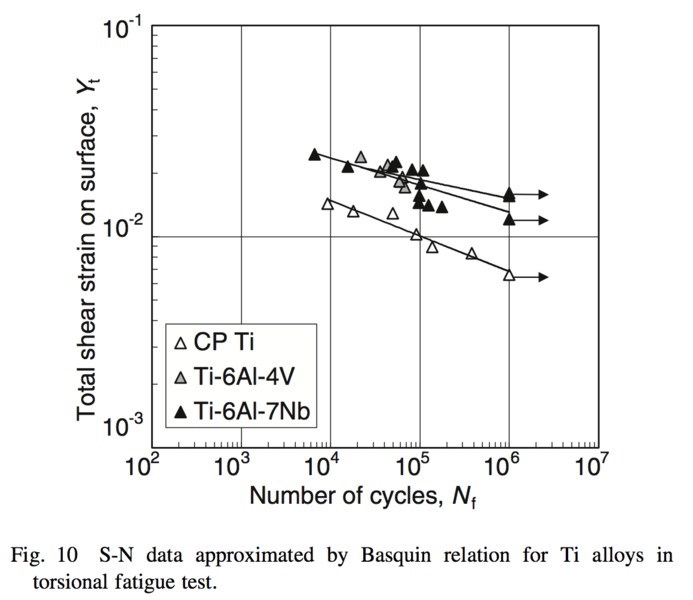
Figure 10. S-N data approximated by Basquin relation for Ti alloys in torsional fatigue test.
File history
Click on a date/time to view the file as it appeared at that time.
| Date/Time | Thumbnail | Dimensions | User | Comment | |
|---|---|---|---|---|---|
| current | 00:10, 4 May 2015 | | 1,160 × 1,004 (118 KB) | Bourgeois (Talk | contribs) | Figure 10. S-N data approximated by Basquin relation for Ti alloys in torsional fatigue test. |
- Edit this file using an external application (See the setup instructions for more information)
File usage
The following page links to this file: